
A useful business dashboard brief starts with a decision, a named user and a measure they can explain. Define the source records, calculation, reporting period and exclusions before choosing a chart. Then agree how fresh the data must be, who may see it and what evidence will demonstrate that the report works.
This is work the business and delivery team do together. “Show sales and operations in one place” is an ambition, but it leaves unanswered whether sales means orders, invoices, payments or recognised revenue. A good brief exposes that disagreement while it is still inexpensive to resolve.
Describe one recurring scene. For example, an operations manager reviews orders whose promised delivery deadline has passed, identifies the outstanding ones and assigns follow-up. The report needs to support that task, including a path from a summary count to the relevant records. A decorative trend line alone would not complete it.
Name the person who makes the decision and the person who owns the underlying definition. They may be different people. If the finance team owns a measure's business meaning, a dashboard developer should not silently redefine it because a convenient source column has a similar name.
Microsoft's report requirements guidance covers purpose, audience, expected action, calculations, sources, freshness and security. Its solution-planning guidance distinguishes business design from the technical work needed to validate the design. Use those conversations to find a practical first release, with unresolved questions recorded.
Use this original worksheet for each important measure. Write a short answer in every row and name an owner where the answer is still unknown. Do not let a mock-up turn an unapproved assumption into a finished-looking business rule.
| Requirement | What to record | A review question |
|---|---|---|
| Decision and audience | The person, recurring task and next action | Can the user explain what they will do after reading the result? |
| Unit of analysis | What one row or counted item represents | Is this an order, order line, shipment or customer? |
| Calculation | Numerator, denominator, aggregation and units | Can someone reproduce the number from a small example? |
| Time rules | Reporting date field, timezone and cutoff | Are we grouping by creation, due date or completion? |
| Inclusion rules | Statuses, exclusions and duplicate treatment | What happens to cancellations, missing dates and repeated records? |
| Source and owner | System, required fields and business approver | Who can resolve a missing value or definition dispute? |
| Freshness | Expected delay, last successful update and failure response | How will a reader recognise stale data? |
| Access and output | Viewers, editors, exports and supported devices | Can each role complete its task without seeing unrelated detail? |
| Acceptance and operation | Test cases, handover assets and support owner | Who confirms the release and maintains it afterwards? |
Make grain explicit before combining sources. Joining an order header to several order lines can repeat the header's amount. If a report needs order-level measures, its implementation must respect that unit even when the underlying preparation uses detailed rows. This is a design question to test, not a reason to assume every join is wrong.
Consider an entirely hypothetical order review, with invented records and no client-performance claim. The team wants to know what share of eligible orders due during a particular week were delivered by their original promised deadline. It uses Riyadh time, freezes the review at Friday 18:00 and excludes orders cancelled with approval before their deadline. This cancellation rule is an example, not a recommended rule for every business.
Each order below has one delivery deadline. The deadline has not been revised, and the cutoff is later than all listed deadlines. The source evidence confirms all delivery and cancellation states; the outstanding order is known to be undelivered, rather than having an unexplained missing delivery field.
| Order | Original deadline | State at the review cutoff | Treatment in this measure |
|---|---|---|---|
| A | Monday 16:00 | Delivered Monday 15:00 | Eligible and on time |
| B | Tuesday 16:00 | Delivered Tuesday 17:00 | Eligible and late |
| C | Wednesday 16:00 | Delivered Wednesday 15:00 | Eligible and on time |
| D | Thursday 16:00 | Undelivered at Friday 18:00 | Eligible and overdue |
| E | Friday 16:00 | Delivered Friday 14:00 | Eligible and on time |
| F | Friday 16:00 | Cancellation approved Thursday 10:00 | Excluded under the stated rule |
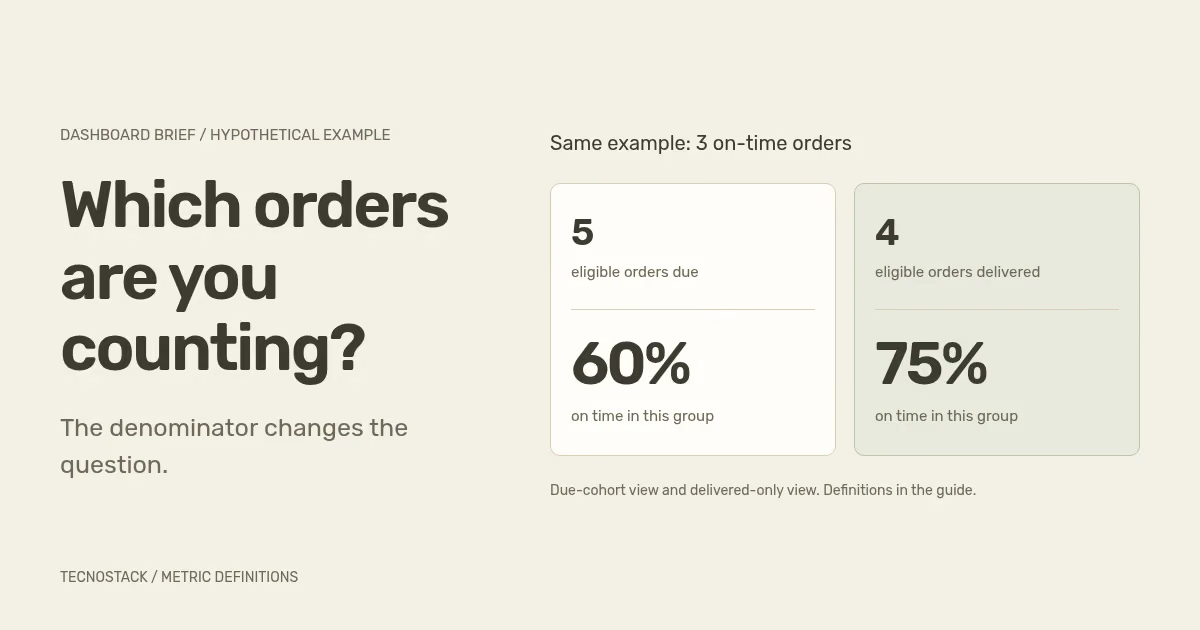
There are six source orders and five eligible orders after the exclusion. Three were on time, so the defined measure is 3 / 5 = 60%. The denominator includes the eligible overdue order because its promise was not met by the review cutoff.
If a report first filters out every undelivered order, only four eligible delivered orders remain. Its calculation becomes 3 / 4 = 75%. That answers “what share of delivered orders met their deadline?” It does not answer the original question about all eligible orders due in the week. Neither label should be shortened to an unexplained “on-time rate”.
Retain the excluded and outstanding counts beside the result, with a route to inspect their treatment. If the business instead wants shipment-level performance, revised promises or another cancellation rule, create a separately named definition and rerun the acceptance examples. Do not change the denominator quietly between reporting periods.
List the fields that the calculation depends on, including stable identifiers and the timestamps needed to apply the rules. Missing delivery evidence is different from a confirmed undelivered state. Agree how unknown records are disclosed and whether the measure is withheld, qualified or calculated over an explicitly named subset.
For each source, distinguish the time a business event occurred, the time the source stored it and the time the report retrieved it. A successful refresh cannot make an upstream record more current than the source itself. Record both the reporting cutoff and the relevant update status so a reader can judge the result.
Decide which corrections belong in the operational system and which transformations belong in reporting. The CRM and ERP ownership worksheet helps assign fields and exception handling. Avoid making the reporting copy an undocumented second authority for customer or order records.
Describe the tasks people must complete: choose a period, identify an exception, inspect the permitted detail and export an agreed view. Include the actual language and device requirements. Arabic labels, mixed-direction identifiers, dates and long category names need representative content in the prototype, rather than empty boxes that hide wrapping problems.
Use text, symbols or another visible distinction alongside meaningful colour. W3C's use-of-colour guidance explains why colour alone cannot carry the message. For example, write “overdue” beside the count instead of expecting everyone to interpret a red tile. This check is one part of accessibility review, not a claim of complete conformance.
Test access with the intended role. Google's Data Studio credential documentation distinguishes owner credentials from viewer credentials; owner credentials can let people view report data without their own access to the source. That is a sharing decision to make deliberately. A page filter or a hidden tab should not stand in for an agreed data-access boundary.
Give reviewers tasks with expected outcomes. In the example, they should reproduce 60%, find the overdue order, explain the exclusion and confirm the cutoff. Add cases for an empty period, a duplicate source row, missing evidence and a failed refresh. The report should communicate those states rather than displaying an unexplained zero.
Document who may change a definition, approve a new source and renew the required accounts or licences. Keep the metric dictionary and known limitations with the report assets. Training should include recovering from a common failure and identifying when the source owner needs to act. Use the Power BI and Data Studio trial worksheet to test those requirements before choosing a platform.
For enquiry reporting, the lead-quality reconciliation guide provides another worked denominator example. If your team needs help turning a recurring reporting question into an implementation scope, bring the current report, a redacted sample and the definition owner to our business dashboards and reporting service. We review existing dashboard inclusions before proposing additional work.


