
A/B testing with low traffic is worthwhile when the available eligible users can provide useful evidence for a specific decision. Define the outcome and the effect worth detecting, choose the statistical method, then estimate sample size and duration. A rule such as “run every test for two weeks” cannot answer those questions for every website.
An A/B test assigns comparable units, such as users, to different versions and compares a defined outcome. “Low traffic” is relative to that design. A site might support a test of a common interaction but struggle to distinguish a small change in rare qualified sales. The following worksheet helps you decide what to test, what to investigate another way and what the result could establish.
Write the proposed change, the expected mechanism and the business decision together. For example, a clearer explanation beside an enquiry form might help suitable customers understand what to submit. The primary outcome could be an accepted enquiry per eligible user, with later qualification as a guardrail. More button clicks alone would answer a narrower question.
Choose an effect that would matter enough to act on. Express it in absolute terms as well as relative terms: moving from 5% to 6% is one percentage point, or a 20% relative increase. Those figures are hypothetical, not a suggested baseline or expected improvement. Avoid changing the target effect merely to make a sample-size calculator return a shorter test.
Microsoft's metric-sensitivity research explains how power, effect size and the metric's response to a change affect detection. A conveniently frequent metric is useful only if it represents the question. Replacing qualified enquiries with a button click changes the question; it does not solve the original measurement problem.
Complete this original readiness record before preparing variants. Keep eligibility and analysis rules explicit so the team does not redefine the audience after seeing a favourable result.
| Planning field | What to agree | Reason to resolve it before launch |
|---|---|---|
| Decision and hypothesis | The change, expected mechanism and action after the result | An interesting number may not answer a business decision |
| Eligible population | Who can enter, on which pages and language versions | Whole-site visits can overstate the available sample |
| Randomisation unit | User, account or another justified unit; stable assignment | Repeated visits are not automatically independent observations |
| Primary outcome | Exact event, denominator and follow-up window | A changed definition can create a misleading comparison |
| Effect and analysis method | Useful effect, uncertainty approach and sample planning | The calculation must match the design |
| Guardrails and operations | Errors, lead quality, performance and stop responsibilities | A headline improvement can conceal damage elsewhere |
| Decision and reporting rules | Planned analysis, duration constraints and treatment of inconclusive results | The team needs a rule before the chart starts moving |
Verify assignment and event collection before interpreting outcomes. Microsoft's experiment data-quality guidance covers missing data, duplicates, assignment and sample-ratio mismatch. Check whether observed allocation is statistically consistent with the intended split; random allocation does not require exactly equal counts at every moment.
Use the GA4 tracking audit to inspect success, failure and repeated-action cases. The experiment platform also needs reliable assignment and exposure records. An accurate total event count alone cannot tell you which version a user encountered or whether the two groups lost data differently.
Here is a deliberately hypothetical planning example for two independent proportions. Every input is invented for explanation. Assume one binary outcome per eligible independent user, equal allocation and a fixed-horizon, two-sided comparison. This is not a calculation for revenue, repeated sessions, clustered accounts or a sequential test.
| Input or calculation | Hypothetical value |
|---|---|
| Baseline accepted-enquiry rate | 5% |
| Alternative rate worth detecting in this example | 6% |
| Difference | 1 percentage point; 20% relative |
| Significance level | 5%, two-sided |
| Power at the stated alternative | 80% |
| Approximate users per version, rounded up | 8,200 |
| Total eligible independent users | 16,400 |
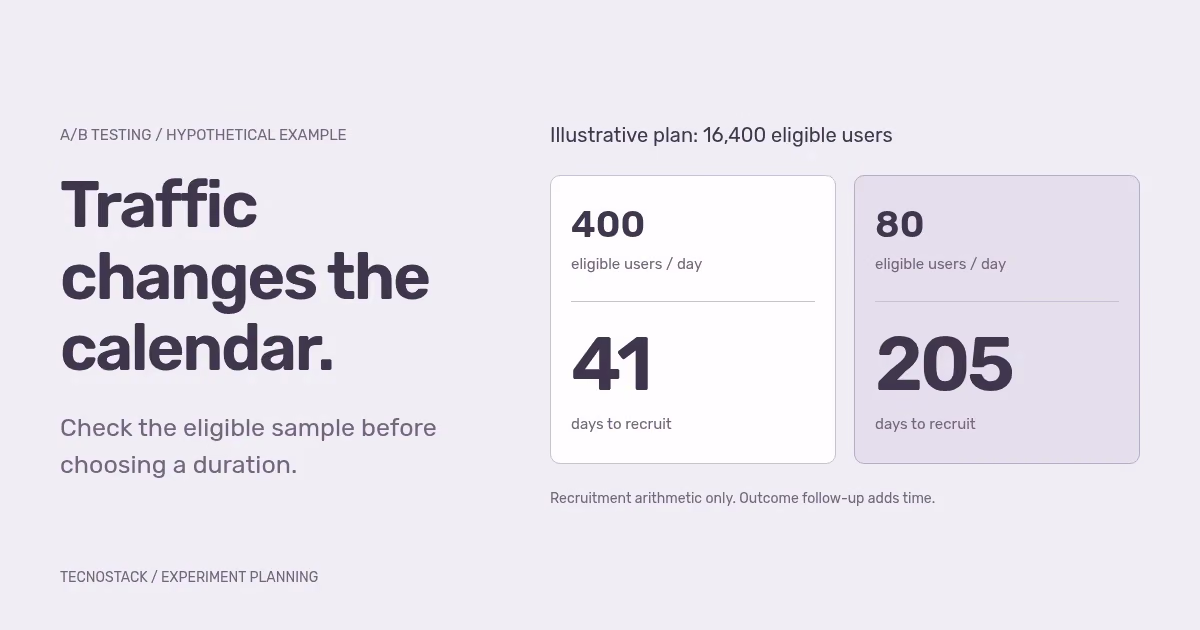
| Recruitment at 400 eligible users per day | 41 days |
| Recruitment at 80 eligible users per day | 205 days |
The sample estimate uses a normal approximation with an arcsine-square-root effect size, documented in statsmodels' proportion effect-size function and two-sample power calculation. The calculation gives about 8,143 users per version before rounding up to 8,200. Other appropriate methods or design assumptions can give different requirements.
The calendar arithmetic is 16,400 / 400 = 41 or 16,400 / 80 = 205. It assumes steady recruitment and no loss of usable observations. Outcome follow-up, processing delays and any planned minimum duration are additional constraints. A user recruited on the final day still needs the agreed opportunity to complete the outcome; ending recruitment does not automatically finish measurement.
Power of 80% describes the chance of detecting the specified alternative under the model's assumptions. It does not mean an 80% chance that the new page will win. Likewise, a 5% significance level is not a statement that a particular winning result has a 95% probability of being true.
The example's useful conclusion is about feasibility. If the offer or audience will change well before recruitment is complete, reconsider the question and design. Do not treat 205 days as a prescription to keep a poorly suited experiment running through unrelated campaign changes.
A sequential method changes how interim evidence is assessed; it does not manufacture information from visitors who have not arrived. Check the method actually enabled in the product, including its assumptions, uncertainty display and decision rules. A platform's name is not enough to identify the analysis used by a particular experiment.
Optimizely's methods overview distinguishes fixed-horizon, Bayesian and sequential approaches. Statsig's sequential-testing documentation explains adjustments for early decisions and notes that an early decision can still leave a noisy estimate of effect size. Do not apply the worked example's fixed-horizon sample estimate as a universal requirement for every method.
With an ordinary fixed-horizon design, repeatedly checking significance and stopping on a favourable snapshot changes the error risk. Follow the agreed analysis plan. You can still monitor broken forms, data loss and serious regressions, and stop for operational reasons; record that action without presenting the interrupted run as a confirmed winner.
Start with the evidence already available. A reproducible validation error can be corrected and verified without waiting for an experiment to demonstrate that it blocks a valid request. The landing-page review worksheet helps distinguish these faults from design preferences.
For an unclear task, run focused usability research, inspect relevant support questions or review the information customers need before contacting the team. These methods can explain why a step is difficult. They do not estimate population-wide conversion uplift, and a few observed sessions should not be turned into a percentage claim.
You can also simplify the proposed comparison or revisit the audience definition when there is a substantive reason. Preserve the original question in the decision record. Broadening eligibility after inspecting results or combining unrelated audiences solely to increase the count can make the answer less useful.
Report the effect estimate with its uncertainty, the sample actually analysed, the outcome window and relevant data-quality checks. Explain whether the evidence distinguishes a practically useful improvement from harm or negligible change. Statistical significance alone does not decide whether implementation and operating costs are worthwhile.
An inconclusive comparison is not proof that the versions are equivalent. Do not rescue it by searching many language, device or campaign segments and reporting only the best-looking result. Treat newly discovered patterns as exploratory questions unless the analysis plan supports the inference you want to make.
TecnoStack's analytics and conversion optimisation service can scope the measurement review, experiment planning or a more suitable investigation. Existing marketing-plan tests and conversion reviews remain within their published scope. Bring the decision, current outcome definition and eligible traffic estimate, then agree what evidence would be enough to act.


