Are your pages fast enough for the people who actually use them? Core Web Vitals answer that with three measurements taken from real visits: how quickly the main content appears (Largest Contentful Paint, LCP), how quickly the page responds to taps, clicks and key presses (Interaction to Next Paint, INP), and how much the layout shifts unexpectedly (Cumulative Layout Shift, CLS).
This guide covers the current thresholds and a workflow from field data to a verified fix. Passing is a user-experience goal; it does not guarantee search rankings or revenue, and no one can honestly promise that it will.
Google's Web Vitals guidance on web.dev sets the current good thresholds: an LCP of 2.5 seconds or less, an INP of 200 milliseconds or less and a CLS of 0.1 or less. Each is assessed at the 75th percentile of page visits, with mobile and desktop measured separately. A page passes only when most visits meet the target, not the average visit.
Each metric catches a different kind of failure:
- LCP marks when the largest content element in the viewport, such as a hero image or headline block, finishes rendering. A poor LCP usually means the main content was discovered late, was too heavy or waited on the server or render-blocking resources.
- INP observes interactions throughout the visit and reflects how long the page took to paint a response. A poor INP usually means the main thread was busy when the visitor tapped, or the handler did too much work.
- CLS adds up unexpected movement of visible content. A poor CLS usually means something arrived without reserved space: an image without dimensions, a banner injected at the top or a late font that reflows text.
Because each metric fails for different reasons, "the site is slow" is never a useful diagnosis. If a tool or report still shows First Input Delay (FID), it is not using the current set; check responsiveness with INP instead.

Figure 1 — Measure real visits. Good thresholds at percentile 75.
Field data comes from real visits on real devices, networks and languages; lab data comes from a controlled test you run yourself. The two answer different questions:
- Field data tells you whether a problem exists, for whom and on which pages.
- Lab data lets you reproduce a problem, inspect a trace and test a fix before release.
A strong lab score next to failing field data is not a contradiction. A page-load test on a fast machine, with no tapping or typing, cannot see the slow interaction a visitor triggers on a mid-range phone several minutes into a visit. Use the lab as a microscope, not as the verdict. Field data can come from public datasets, where your traffic is large enough to be included, or from real-user monitoring (RUM) on your own pages.
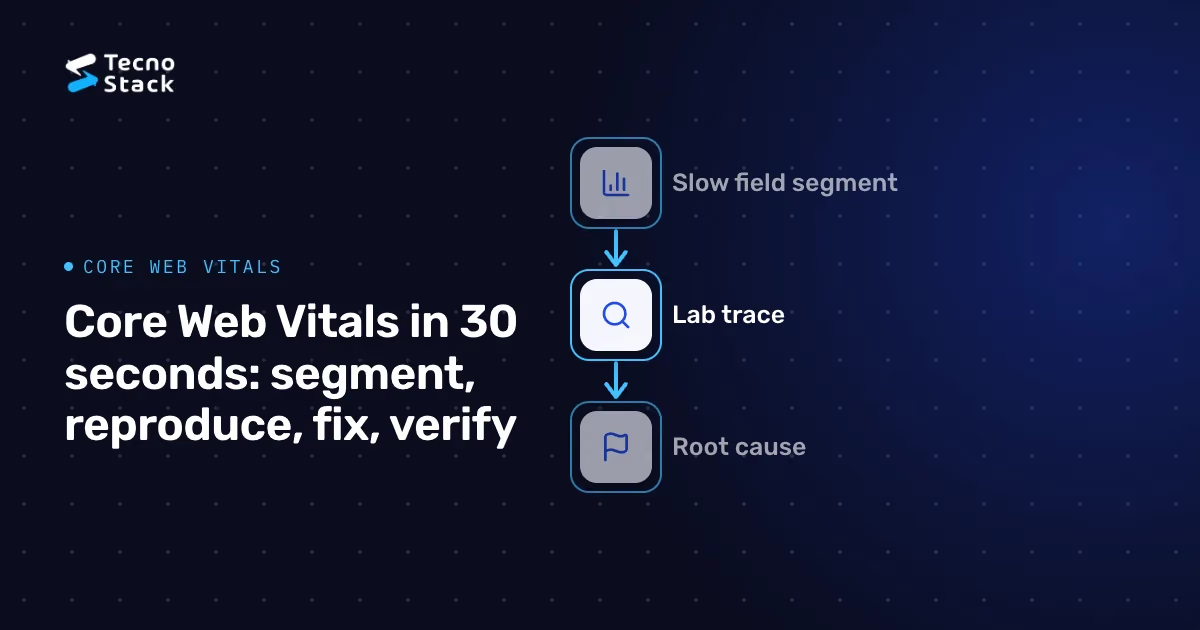
Don't start with the homepage or the lowest lab score. Split field data until the problem has an address:
- Metric: which of the three fails at the 75th percentile?
- Device class: a page can pass on desktop and fail on mobile.
- Page template: group URLs by template, such as article, product, checkout or search, because fixes usually land in a template.
- Language and direction: Arabic and English pages often load different fonts, wrap differently and sometimes use different hero images, so measure each locale on its own.
- Interaction: for INP, note which interaction is slow, such as opening a menu or adding to cart, where your monitoring records it.
An illustrative example: a bilingual store sees mobile LCP failing on Arabic product pages while the English versions pass. A site-wide average would hide this. The segment points to one template in one locale, where a large hero image and an Arabic web font compete for early bandwidth.
Recreate the failing segment: the same template and locale, CPU and network throttling resembling the devices in your field data and, for INP, the actual interaction, by hand or scripted. Record a performance trace, then ask the question that matches the metric:
- LCP: which element was the LCP element, and what delayed it: server response, late discovery of the image, render-blocking stylesheets or fonts, or the image's weight?
- INP: which part of the interaction was slow: the wait before the handler started, the handler's own work or rendering the next frame?
- CLS: which element moved, and what arrived late to push it?
If you cannot reproduce the problem, the segment is probably still too broad, or the cause depends on something your lab lacks, such as a third-party script that loads only for some visitors.
Each cause has a short list of typical fixes:
- Late or heavy main content (LCP): make the hero image discoverable in the initial HTML, size it for the viewport, don't lazy-load it, and reduce server response time with caching where content allows.
- A busy main thread at interaction time (INP): break long tasks into smaller pieces that yield to the browser, send less JavaScript to the client, defer non-essential third-party work and show visual feedback immediately. In React frameworks, keeping non-interactive parts on the server reduces what the browser must hydrate; our guide to server components and caching in Next.js 15 covers that boundary for teams maintaining that version.
- Content without reserved space (CLS): set dimensions or an aspect ratio on images and embeds, reserve space for banners and consent notices, and avoid inserting content above what the visitor is reading. For Arabic web fonts, load only the subsets you need and pick a loading strategy whose fallback doesn't reflow the page.
Fixes last longest in shared components: an image component that refuses to render without dimensions, or a banner slot with a fixed height. Our article on AI-assisted design systems discusses keeping generated components consistent and reviewable.
A lab improvement is a hypothesis until field data confirms it. After release, compare the same segment, metric, device class and locale before and after the change, once enough real visits have accumulated. Record release dates so a later regression can be traced to a specific change.
Then make the fix hard to undo:
- Add lab performance budgets to build or pull-request checks as an early warning; they won't catch every field problem.
- Keep real-user monitoring segmented by template, device class and locale.
- Review third-party scripts before adding them; they share the main thread with your visitors' interactions.

Figure 2 — Verify after release. Compare the same segment.
Some fixes help both. Reserving space for a late banner removes layout shift and stops content jumping under a keyboard user's focus. Other changes quietly harm accessibility: removing focus outlines, dropping image text alternatives or lazy-loading a control that keyboard users need. The W3C's WCAG 2.2 quick reference lists success criteria for keyboard access, visible focus, text alternatives and contrast; review performance changes against them. A passing automated audit does not certify full accessibility, so keep human review in Arabic and English, including right-to-left layouts.
Sometimes the investigation reveals a product question rather than a performance bug, such as whether an app-like experience belongs in the browser at all; our guide to choosing between a PWA and a native app covers gathering capability evidence on target devices. If you want help turning field data into a prioritized fix list, our search engine optimisation service combines technical improvements with content and search strategy.
- Google, web.dev. Web Vitals: the current metrics, their good thresholds and assessment at the 75th percentile, segmented by mobile and desktop.
- W3C Web Accessibility Initiative. How to Meet WCAG 2.2 (Quick Reference): the accessibility success criteria referenced above.
Metric definitions and tools change, so check the current documentation before setting targets. The recommendations in this article are TecnoStack's guidance, not requirements from Google or the W3C.